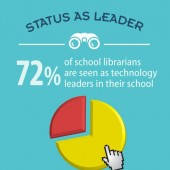
Librarians are leading the way in technology use, according to School Library Journal’s annual technology survey. SLJ’s got the proof, and we encourage you to share it.
On Libraries and New Media, powered by Library Journal and School Library Journal
Librarians are leading the way in technology use, according to School Library Journal’s annual technology survey. SLJ’s got the proof, and we encourage you to share it.
You can create infographics—visual representations of data—from scratch using free web tools. Library consultant and educator Linda W. Braun takes you step by step through making your own infographic using easel.ly and info.gram.
“You’ve seen infographics, right? Those visual representations of information that seem to be popping up everywhere on the Internet?,” writes Travis Jonker. Here’s his effort using easelly.